
Private Label Android Tablet Procurement: How to Read Conflicting 2026–2032 Market Forecasts Before Committing to MOQs
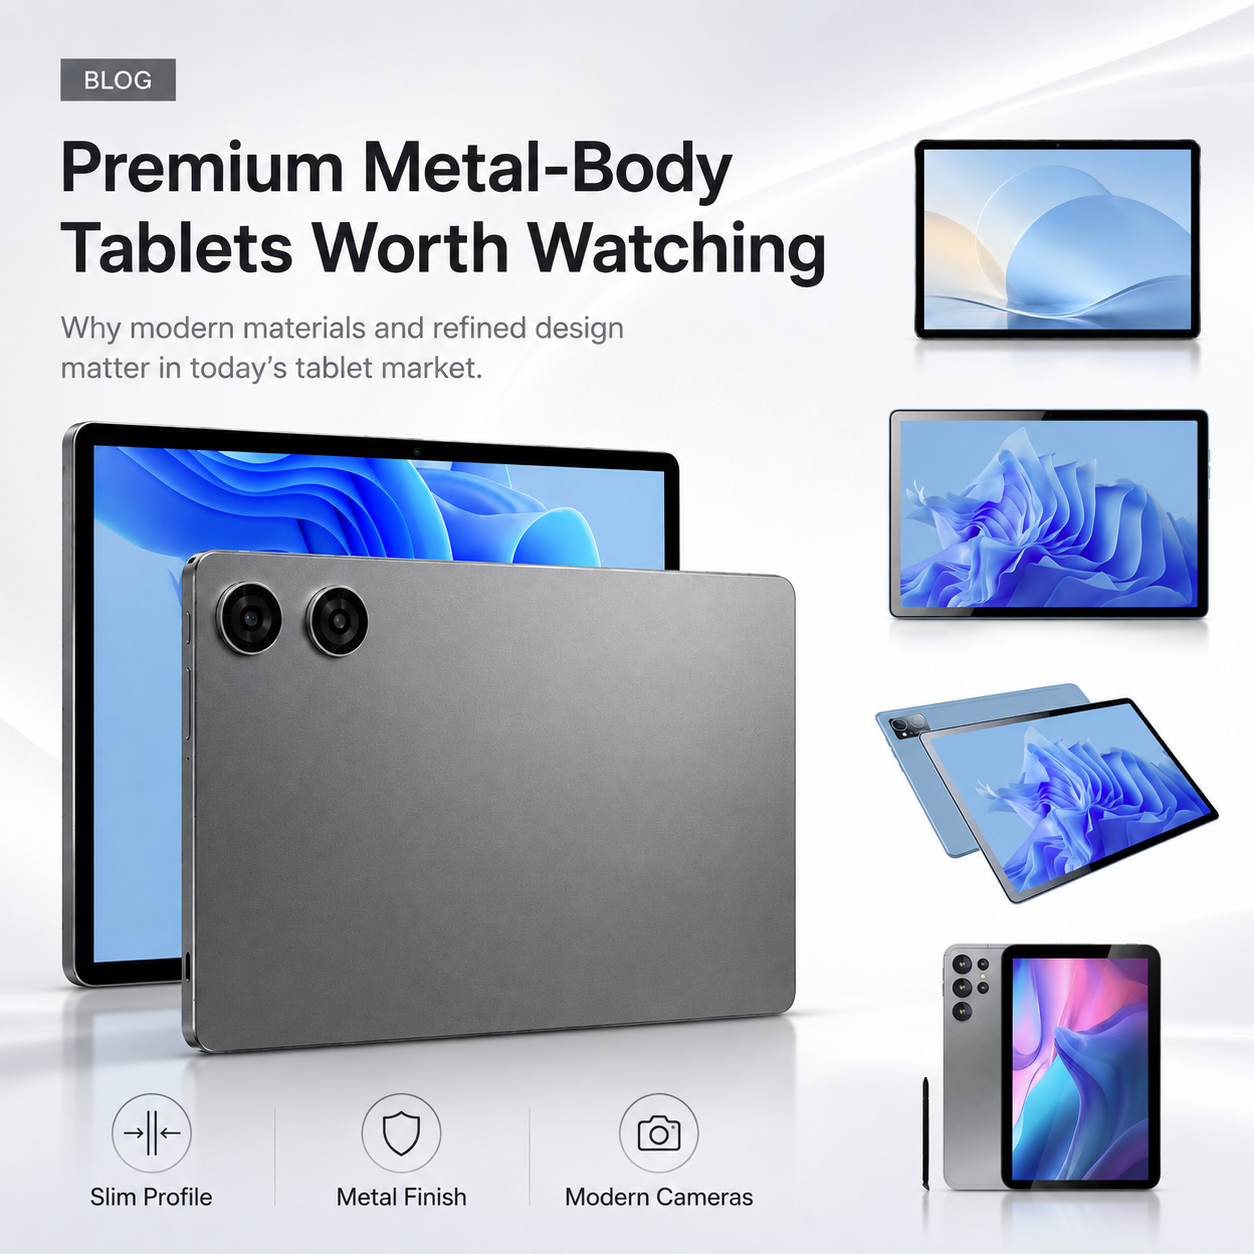
Private label Android tablet procurement forces you to act while the market data itself disagrees. Public 2026–2032 forecasts range from a 4.1% to a 9.5% CAGR, and that spread is not noise you can wish away — it is the difference between committing to a defensible volume and over-committing to a factory MOQ. The workable approach is to treat every forecast as a guardrail, not a headline, and to hang your sourcing plan on the signals the reports actually agree on.
Why Two Forecasts Can Both Be Right — and Still Mislead You
The core problem in private label Android tablet procurement is not that one forecast is wrong and another right: it is that value-based reports, unit-shipment figures, and different base years describe different things while using identical vocabulary. Understand the source’s basis before you let it set your MOQ. This article gives you a reconciliation toolkit that turns contradictory market data into a segment split, a volume band, and a per-SKU cost model you can defend in an RFP.
For a practical vendor example, readers can review custom Android tablet factory.
The Actual 2026–2032 Numbers: A Side-by-Side Reconciliation
Reading the major research houses side by side shows why a single headline number misleads. Each firm applies a different basis, base year, and CAGR.
| Source | Basis | Base year | CAGR | Horizon |
|---|---|---|---|---|
| Maximize Market Research | Value (USD) | 2025: $57.53B | 6.1% | 2026–2032 |
| Coherent Market Insights | Value (USD) | 2026: $59.88B | 4.1% | 2026–2033 |
| Credence Research | Value (USD) | 2024: $84.6B | 9.47% | to 2032 ($174.47B) |
| Research and Markets | Value (USD) | 2026: $121.61B | 6.8% | to 2030 ($158.37B) |
The 2024 shipment base of roughly 168 million units sits separately from these value figures ([2]). Three drivers create the divergence: value-versus-unit basis (a premium-OLED mix inflates value per unit even when shipments shrink), base-year scope (2024 vs 2025 vs 2026 start points compound differently), and market definition (some houses count accessories and services, others devices only).
Which Signals Actually Converge: What Buyers Can Trust
Where the reports disagree on total, they converge on structure. These are the durable signals to plan around:
- Android holds roughly 52.7% of platform share — the default choice for private-label programs on cost and ecosystem fit.
- Larger screens dominate, but the percentage differs by weighting: >10-inch devices account for about 64% of global sales by value, while 8–10-inch competitors claim ~45% by unit ([2]). The gap is unit-vs-value weighting, not a contradiction.
- ~34% of 2024 global enterprise mobility spend went to tablets — POS, clinical, retail, and hospitality workflows are a genuine planning anchor ([2]).
- 5G adoption is rising: global 5G tablet shipments grew 18% in 2024, projected toward 55% of sales by 2030 ([2]).
For procurement, these mean: plan your mix around value-heavy large-screan units for enterprise, and benchmark your own cost model against the enterprise spend anchor rather than the total-market headline.
From Forecast to Volume: A Decision Framework Before You Issue the RFP
Turn the convergence signals into a volume plan before you approach any factory:
- Lock your segment split — rugged, enterprise/kiosk, and education each carry different demand drivers and compliance loads.
- Set a unit-volume range from the floor and ceiling of the credible forecasts, not a single midpoint — the 4.1% to 9.5% CAGR spread gives you a defensible band.
- Derive the MOQ as a percentage band of your volume, so the factory’s minimum stays well inside your credible range.
- Build a per-SKU cost model with upper and lower bounds that tolerates input-price movement.
Keep the callout visible: a forecast is a guardrail, not a sales target. Your committed volume should sit inside the band, never at its optimistic edge.
Modeling MOQ and Cost With Forecast Uncertainty
The wider the forecast divergence, the more defensible a smaller initial MOQ with a phased volume commitment becomes. Standard GMS-certified units now accept light customization at MOQs in the 50–100 unit range, while custom OS/firmware work pushes the minimum much higher — so treat MOQ as a lever tied to how far you customize ([1]). The real decision variable is not unit price but tablet total cost of ownership: firmware updates, Android Enterprise management readiness, and lifecycle support dominate multi-year cost. Negotiate phased commitments against that figure, not against the sticker price.
Segment Splits That Survive the Data: Rugged, Enterprise, Education Checklist
Copy this pre-flight checklist into your RFP:
- Rugged: confirm IP rating, high-brightness display for outdoor kiosks, and an extended lifecycle commitment matched to field-service and construction demand ([2]).
- Enterprise/kiosk: require GMS certification so the unit supports Android Enterprise device management and kiosk mode tablet deployment ([3]).
- Education: verify privacy and durability features against district compliance, and align with education-segment demand signals.
Let your deployment use-case — not the most optimistic CAGR — set the segment weighting. A kiosk program and a school rollout need different hardware, and their market trajectories differ ([4]).
Turning the Framework Into a Procurement Action Plan
The condensed four-step plan: reconcile sources → set your segment split → fix MOQ bands → build a grounded cost model. Once your volume and segment assumptions are defensible, move downstream to partner qualification — see how to qualify an OEM/ODM tablet partner and pair your cost model with the digital signage RFP display specifications guide. Orders of magnitude still come down to your numbers, so keep 2026–2032 as a range you manage, not a prediction you bet the factory on.
For product details and project planning, see custom tablet firmware and packaging.
Related guides
- 2026 DRAM price surge compute sizing Android signage: How to Right-Size Compute for Wall-Mounted Android Signage
- How Often to Clean Gutters: A Homeowner’s Guide to the Right Schedule for Your Property
Planning an OEM tablet project?
Share the required screen size, performance, RAM/storage, firmware, branding, certifications, destination market and expected quantity so Wintouch can confirm a suitable configuration and project plan.
- Phone
- +8613922898904
- [email protected]
- +8613922898904
Content reviewed: 2026-08-18.
Evidence confidence
Confidence: Medium. This rating reflects cross-checking 4 sources across 4 independent domains. It measures evidence coverage, not certainty; verify safety-critical work against manufacturer instructions and local requirements.
References
APA 7th edition
- ↑Topicon. (2026). OEM & ODM Tablet Manufacturing Process Explained. https://www.topicon.hk/blog-detail/tablet-manufacturer.html.
- ↑Cited 5 timesMaximizemarketresearch. (n.d.). Global Tablet Market 2026–2032: Market Size, Share, Growth. Retrieved August 18, 2026, from https://www.maximizemarketresearch.com/market-report/global-tablet-market/115033/.
- ↑Quantem Blog. (n.d.). What is Android Enterprise?. Retrieved August 18, 2026, from https://quantem.io/blog/what-is-android-enterprise.
- ↑Alibaba. (n.d.). Private Label Android Tablet Sourcing Guide 2026. Retrieved August 18, 2026, from https://electronics.alibaba.com/product/private-label-android-tablet.